
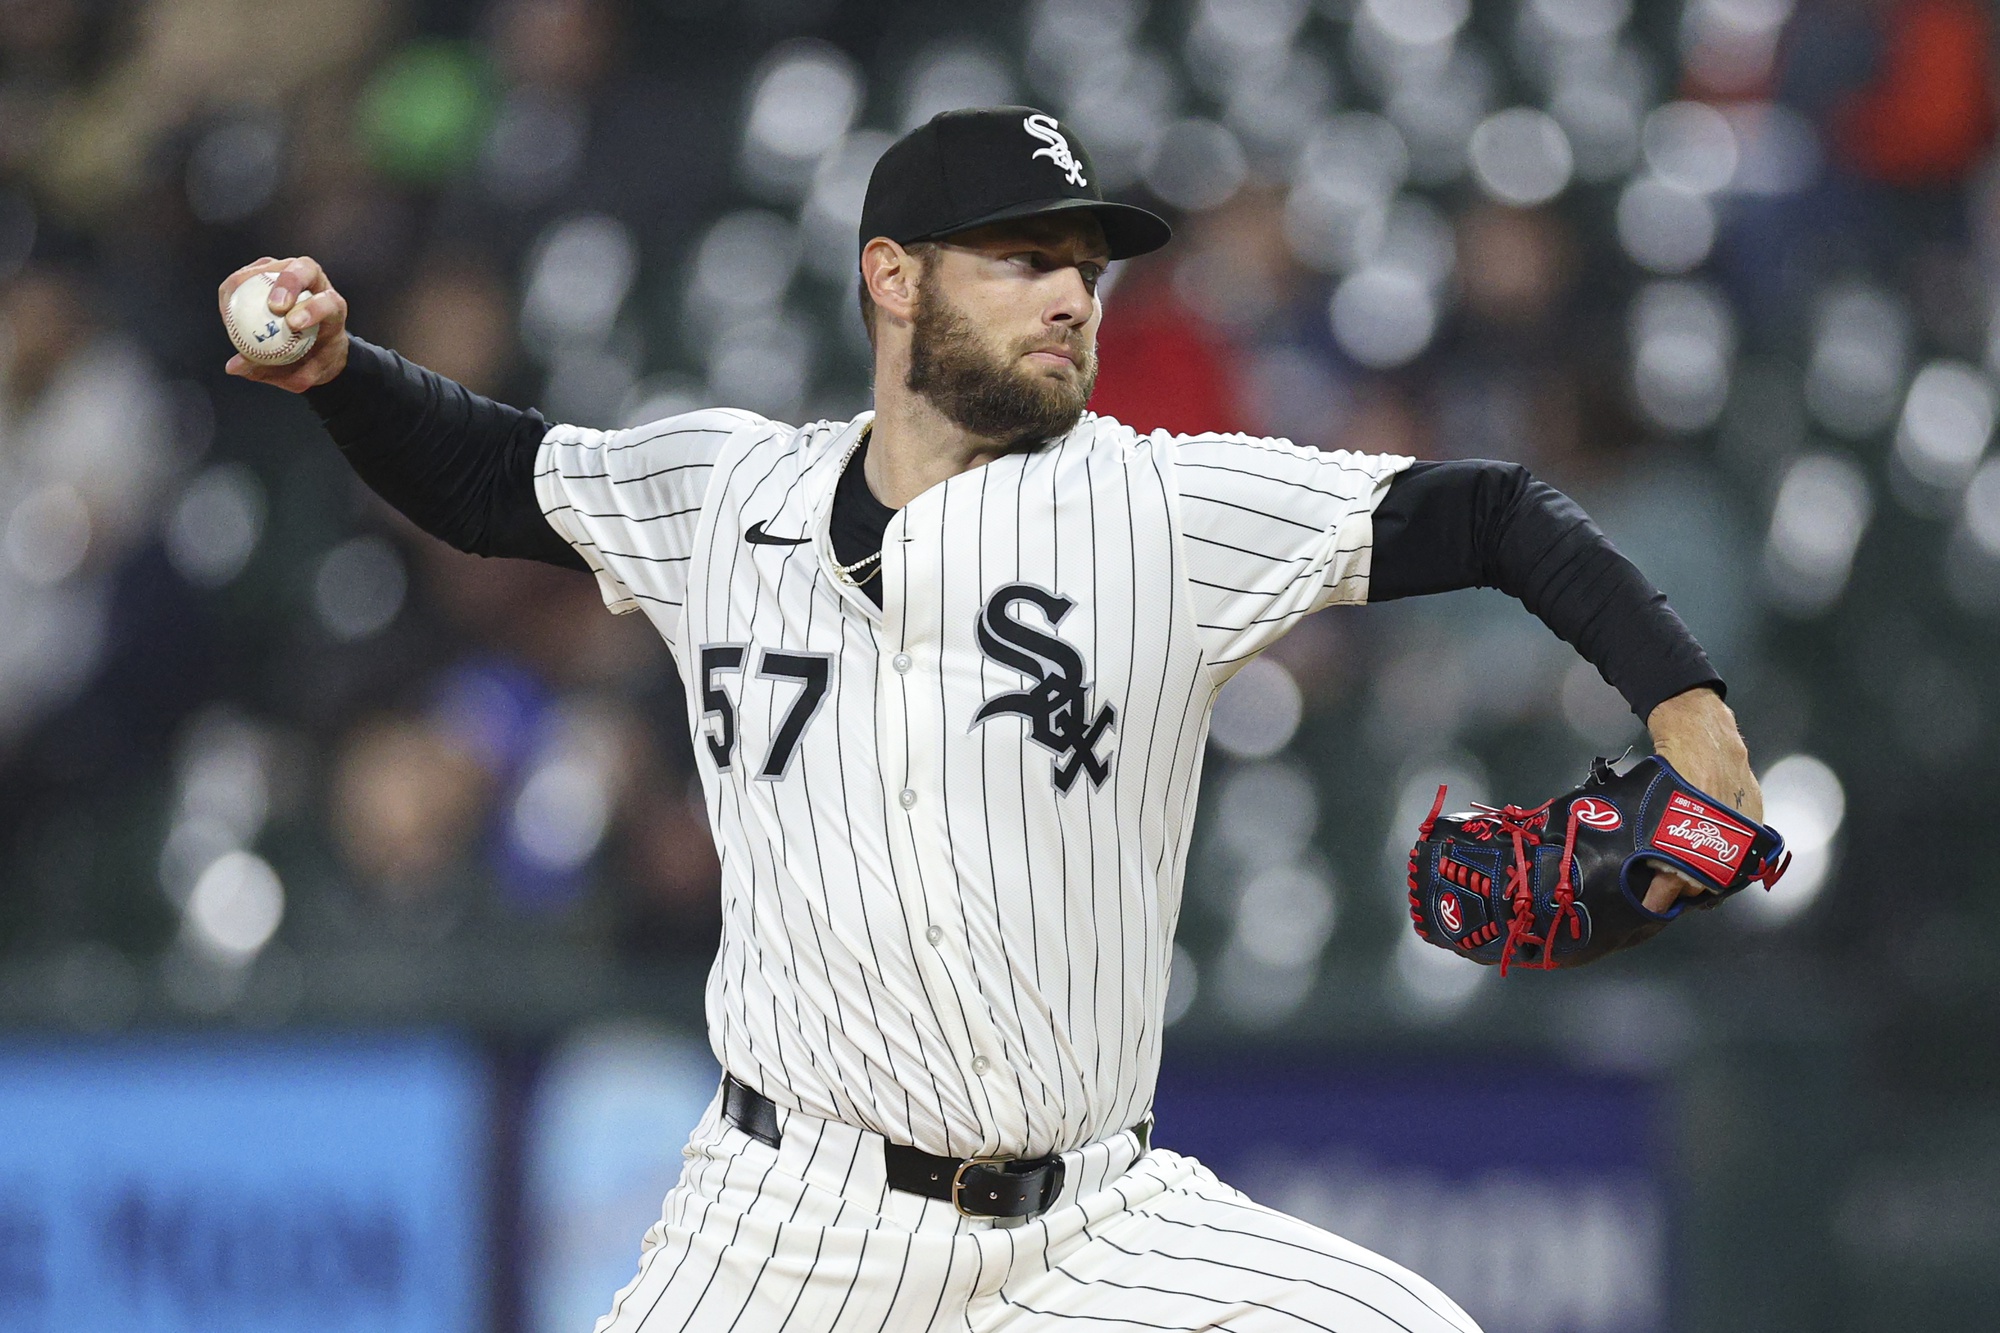
Assuming Adrian Houser pitches in his return to Rate Field this week -- the Rays have yet to announce their probable starters -- he will be tasked with preserving his place on the White Sox Wins Above Replacement leaderboards.
Granted, that's probably not how he would phrase it. He'd probably say something boring like "My job is to give the Rays a great chance to win," but they're two sides of the same coin, because both involve shutting down Colson Montgomery and Kyle Teel.
We've spent some time focusing on the home run race, but the WAR derby is equally intriguing. It's just not as easy nor satisfying to track, starting with the fact that the numbers aren't updated until the next day, and even seemingly fixed totals like Houser's can shift over the course of the season because league contexts change. Also, nothing explodes in the sky when a player adds a third of a win.
But the more complicating factor is that there are two systems that prioritize different aspects of jobs, and thus can spit out vastly different rankings. Here's how the White Sox season leaders stack up according to Baseball-Reference.com and FanGraphs:
| Player | bWAR | Player | fWAR |
|---|---|---|---|
| Adrian Houser | 3.0 | Colson Montgomery | 2.0 |
| Colson Montgomery | 2.6 | Kyle Teel | 1.9 |
| Mike Vasil | 2.5 | Adrian Houser | 1.8 |
| Edgar Quero | 1.9 | Chase Meidroth | 1.8 |
| Kyle Teel | 1.8 | Shane Smith | 1.4 |
Houser is a classic case of the bWAR/fWAR philosophical divide with pitchers, where B-Ref uses RA/9, and FanGraphs uses FIP. The number becomes a question of whether you value results, no matter how they happened, versus how sustainable a pitcher's method of securing those results graded out.
In Houser's case, he had a 2.10 ERA over 68⅔ innings with only a few unearned runs, while his FIP was 3.34, so it makes sense that bWAR would regard him as a Cy Young candidate while fWAR merely considered him pretty good. Houser has since regressed with the Rays, so FIP better reflected the power of the individual pitching performance.
I actually like having the two measurements, because Houser couldn't have been expected to perform any better from a standpoint of run prevention with the White Sox even if he doubled his strikeout rate, but it's also nice to have a system highlighting the pitchers who are better at doing it all by themselves. It just so happens that the trade locked in all his good work on the South Side. His lesser work with Tampa Bay will water down his overall numbers, but the White Sox experienced concentrated excellence.
Houser is the most noticeable discrepancy, but he's not the biggest one. Mike Vasil is a highly valuable relief weapon according to bWAR (2.5) but barely adequate by fWAR (0.3) due to an even bigger divide between his 2.93 RA9 and his 4.42 FIP. On the position-player side, Kyle Teel and Edgar Quero are running neck-and-neck according to B-Ref, but that's because the defensive equation doesn't include framing. FanGraphs does lump in receiving, which is why Teel grades out as 1.5 WAR better.
I'll be curious to see whether Montgomery can top both leaderboards, or whether Houser will somehow lead the team despite only being on the roster for two whole months, but the end results will still require a level of discernment and explanation that raw counting stats don't.
Perhaps the WAR-related discussion that better reflects the team's fortunes is how many position players in 2025 will end up better than the White Sox's best position player in 2024.
| Player | bWAR | Player | fWAR |
|---|---|---|---|
| 2025 Montgomery | 2.6 | 2025 Montgomery | 2.0 |
| 2025 Quero | 1.9 | 2025 Teel | 1.9 |
| 2025 Teel | 1.8 | 2025 Meidroth | 1.8 |
| 2025 Vargas | 1.7 | 2025 Sosa | 1.3 |
| 2025 Tauchman | 1.5 | 2025 Tauchman | 1.2 |
| 2025 Meidroth | 1.4 | 2025 Robert | 1.2 |
| 2024 Robert | 1.4 | 2025 Vargas | 1.2 |
| 2024 DeJong | 1.1 |
Per FanGraphs, seven 2025 White Sox are more valuable than anybody on the 2024 team, while B-Ref has six with a couple on the bubble (Lenyn Sosa and Andrew Benintendi are at 1 WAR). You can quibble with the individual totals, or you can choose to not find them particularly instructive, but there's strength in numbers, because the team totals have a lot to say about the roster's increased strength, in the sense that it no longer needs a machine to breathe.
As a group White Sox hitters have cumulatively amassed 8.9 bWAR and 6.5 fWAR. Those numbers may not mean anything in and of itself, but it makes a lot more sense when compared to what the White Sox produced the year before:
| Season | bWAR | fWAR |
|---|---|---|
| 2024 | -6.7 | -5.8 |
| 2025 | 8.9 | 6.5 |
| Difference | 15.6 | 12.3 |
And wouldn't you know it, but the White Sox are 14 wins better than last season with 18 games still to play.
While this number makes the White Sox's improvement easier to grasp, it's also instructive to place it in the context of the league. As many wins, real and conceptual, as the White Sox gained, they still rank 25th in total bWAR and 28th in fWAR, so the glass-half-empty types will say there's still so much distance to close. If you're an optimist, you can point to the 7.9 fWAR posted by White Sox position-players after the All-Star break, which is good enough for ninth in Major League Baseball.
At this point, you start running into the caveats against using WAR as a predictive tool, so it's safer to say that that the White Sox have started to bridge the gap to respectability, with some room to argue how much distance remains. To the extent that the individual WAR leaderboards matter, the White Sox can take another step when their team leaders spend the entire season on the roster, and can be penciled in for years to come.