
I was very skeptical of Madrigal before he came up. I couldn’t help but wonder: What if his hit tool just doesn’t transfer to the big leagues? I’ve seen too many prospect evaluations that raved over hitters’ contact skills in the minors, just for a promotion to the big leagues be the one filter that finally weeded them out.
But Nick can hit. Even the highest level of MLB pitching couldn’t stop his slap-single ways. His baserunning and fielding haven’t come around as quickly as his hitting, but these tools are usually projected with more accuracy and I expect him to take a step forward in those departments from 2020.
Which brings us to power. It was understood that Nick was going to bring value in every other department instead, and at this point I’d rather have him do what he does best than to trade that off simply to be more well-rounded. It’s still possible for him to develop power; after all it’s better to get a good hitter and hope for improvement in power than it is to draft or acquire a power guy and develop more contact. In the interest of being realistic over idealistic though, let’s just call Nick Madrigal what he is: a great hitter with little power.
This is something that’s made Madrigal so interesting and divisive. Power has jumped across the league and Nick is a rarity in today’s game. Front offices started to properly value slugging percentage and adjusted their sights accordingly. Players changed their approach from techniques like swinging down at the ball in the hopes of creating backspin (how that idea made its way into baseball astounds me) to focusing on launch angle so that they can “elevate and celebrate.” Most importantly, the baseball changed in 2015, giving us the gift of watching MLB slowly change its response from "nothing has changed," to "the baseball is still within regulations," to "the ball is pretty different and we should implement it in Triple-A so that players in the minors can adjust." No matter what you think is most important, the results show that the last four years are not like the rest:
| 2010 | 2011 | 2012 | 2013 | 2014 | |
| Average season ISO | 0.146 | 0.144 | 0.150 | 0.143 | 0.135 |
| % of 450 PA players seasons with ISO above .110 | 21.02% | 17.14% | 15.79% | 14.12% | 24.56% |
| 2015 | 2016 | 2017 | 2018 | 2019 | |
| Average season ISO | 0.151 | 0.162 | 0.171 | 0.161 | 0.183 |
| % of 450 PA players seasons with .110 ISO or less | 22.16% | 9.71% | 6.63% | 9.29% | 4.70% |
I’m not sure what the best number is to split up players into two groups of ISOs, but Madrigal’s highest ISO in the minors was .110 in Double-A, and it's also what FanGraphs projects him for 2021, so it’s interesting here.
I wanted to see how players with low power have fared these past 10 [full] seasons. No power can’t be a positive, but I doubt it’s a death sentence. Players who field poorly, pitchers with little velocity, etc. have all found ways to be above average before. If you only judge players by their weakest quality, you’re not going to see anything that you like, or what they could bring to the table. Still, it’s always good to know what they’re up against.
Here’s a little color chart of players grouped into WAR:
Now here’s that same grouping but only with players with an ISO of .110 or below:
The biggest thing is how many fewer players there are in the second chart, but also that everything has shifted to the left. Obviously separating a stat by good numbers and bad numbers is going to show a decrease, but how much it affects an all-encompassing stat like WAR is important. I wouldn’t expect to see this much of a shift with fielding or baserunning. How it affects offense is even more obvious. wRC+ works so that an average offensive season is 100, and dropping it down to 95 shows every player that had a just-about-average season. This is how it looks when you input that same division:
% of players with a 95 wRC+ or above
| All ISOs | ISOs above .110 | ISOs .110 or below | |
| 2019 | 76 | 80 | 13 |
| 2018 | 72 | 77 | 29 |
| 2017 | 72 | 76 | 42 |
| 2016 | 73 | 77 | 35 |
| 2015 | 69 | 80 | 31 |
| 2014 | 75 | 84 | 45 |
| 2013 | 75 | 82 | 33 |
| 2012 | 73 | 81 | 26 |
| 2011 | 71 | 79 | 33 |
| 2010 | 70 | 81 | 30 |
| Average | 73 | 80 | 30 |
So these players have an average season or better at the plate 30% of the time. Do they make up for it in other areas? Sometimes. The difference between a replacement player and an average one is roughly 2 WAR, but since I dropped the PA threshold to 450, I dropped the WAR to be an average player to 1.5. These low ISO players hit 1.5 fWAR or more 49% of the time, which is a decent jump.
I know this is all seems pretty bleak, but I’m just trying to illustrate the uphill battle that a player like Madrigal has. It’s not impossible, and since 2010 there have been 13 seasons by 11 different players where they produced more than 4 fWAR even though their ISO was .110 or lower. That means there’s two players on this list who have done it multiple times, and Ichiro Suzuki did it seven times if you go further back than 2010. I’ve put these seasons together to try and find some patterns, and possibly learn what low-power players are able to still be stars, and how they did it. Take a look at some of these low-ISO stud seasons, itemizing offensive, defensive and baserunning runs:
| fWAR | Year | Player | Pos | Season ISO | Career ISO | wRC+ | O-Runs | D-Runs | B-Runs |
| 5.7 | 2018 | Lorenzo Cain | CF | .109 | .125 | 124 | 24.8 | 10.7 | 6.4 |
| 5.9 | 2015 | Francisco Cervelli | C | .106 | .114 | 117 | 9.4 | 30.6 | -0.8 |
| 4.8 | 2015 | Dee Gordon | 2B | .085 | .075 | 116 | 16.6 | 8.4 | 4.8 |
| 4.6 | 2015 | Xander Bogaerts | SS | .101 | .167 | 111 | 12.0 | 9.9 | 3.9 |
| 4.6 | 2014 | Howie Kendrick | 2B | .104 | .136 | 114 | 11.6 | 9.5 | 0.9 |
| 4.4 | 2014 | Lorenzo Cain | CF/RF | .110 | .125 | 109 | 10.3 | 14.4 | 5.1 |
| 4.2 | 2014 | Erick Aybar | SS | .100 | .101 | 101 | 3.2 | 14.8 | 2.6 |
| 5.1 | 2011 | Brett Gardner | LF/CF | .110 | .141 | 97 | 7.5 | 20.9 | 9.6 |
| 6.2 | 2010 | Brett Gardner | LF/CF | .103 | .141 | 112 | 19 | 20.5 | 10.9 |
| 5.0 | 2010 | Yadier Molina | C | .080 | .123 | 84 | -15.7 | 48.3 | -5.8 |
| 4.8 | 2010 | Ichiro Suzuki | RF | .079 | .091 | 110 | 13.5 | 6.6 | 4.6 |
| 4.4 | 2010 | Michael Bourn | CF | .080 | .091 | 89 | 2.2 | 21.8 | 10.5 |
| 4.1 | 2010 | Austin Jackson | CF | .107 | .124 | 101 | 8.3 | 7.5 | 7.3 |
For the season strikeout and walk rates, I color-coded anything that was over/under 4% of that given season’s average for strikeouts, and over/under 2% of that given season’s average for walks.
First thing to look at is position: You can’t make this list playing first base or DH. The positional adjustment is just too steep to make up for with a low ISO. Power guys can make their offensive contributions in big chunks that can take their wRC+all the way into the 190s, while the guys on this list only break 120 once. Over half of the seasons here feature more defensive runs earned than offensive runs. Premium positions only in this exclusive club.
The next category to look at is BABIP. While strikeout and walk percentages have varied year by year, BABIP is somewhere between .295 and .300 for every year of this period. Most of those rates make it look like a bunch of lucky seasons, which is why I have them side by side with their career rates. The majority of these hitters regularly put the ball in play with better results than average. This is not just random fortune, this is their game.
For balls not put into play, check the colors. When putting the ball in play is a part of your expertise, striking out is not an option. There’s only one season here in the red, and that’s also the only season that exceeds the strikeout rate average of that given year. I was expecting to find better walk rates, since that’s an offensive contribution that doesn’t raise ISO, but that wasn’t the case. There’s three seasons notably above average, five around average, and five notably below. Walks are great, but they’re usually not as valuable as base hits no matter how many times you heard your little league coach say “a walk’s as good a hit.” When your BABIP is as high as some of these seasons, you don’t need walks to have a great on-base percentage.
Lastly, there’s the ISO -- specifically compared to their career ISO. This list comprises low-power guys playing their game, no-power hitters who found a different way to be valuable. Xander Bogaerts doesn’t fit the mold anymore, but at the time he did. He didn’t really discover his power stroke until 2016 or 2018. During his 2015 season, he was doing what most of the other guys on this list were doing: playing their small game as best as they could with excellent results.
Before I felt good about Nick Madrigal’s hit tool, I was worried he might be similar to Yolmer Sánchez. That’s a great guy off the bench, but a waste of a No. 4 overall draft pick and future I no longer envision for him. We need a guy who we can measure in Wins Above Average, and not just Wins Above Replacement, if he’s going to be part of a core that the Sox build around, and I’m growing more confident that we have that. Now the next divider would be whether he’s a starter or a possible star. There are few guys with little power who can do that, but the ones who do check these boxes:
- Plays a valuable defensive position
- Doesn’t strike out
- Gets good results putting the ball in play
- Plays the grinder game at the plate
Check, check, check and check. So yes, it has always been rare that slap-hitting ballplayer can have that good of a season and rarer now more than ever. But if you’re trying to think of a player who fits the mold all you have to do is check the title again.
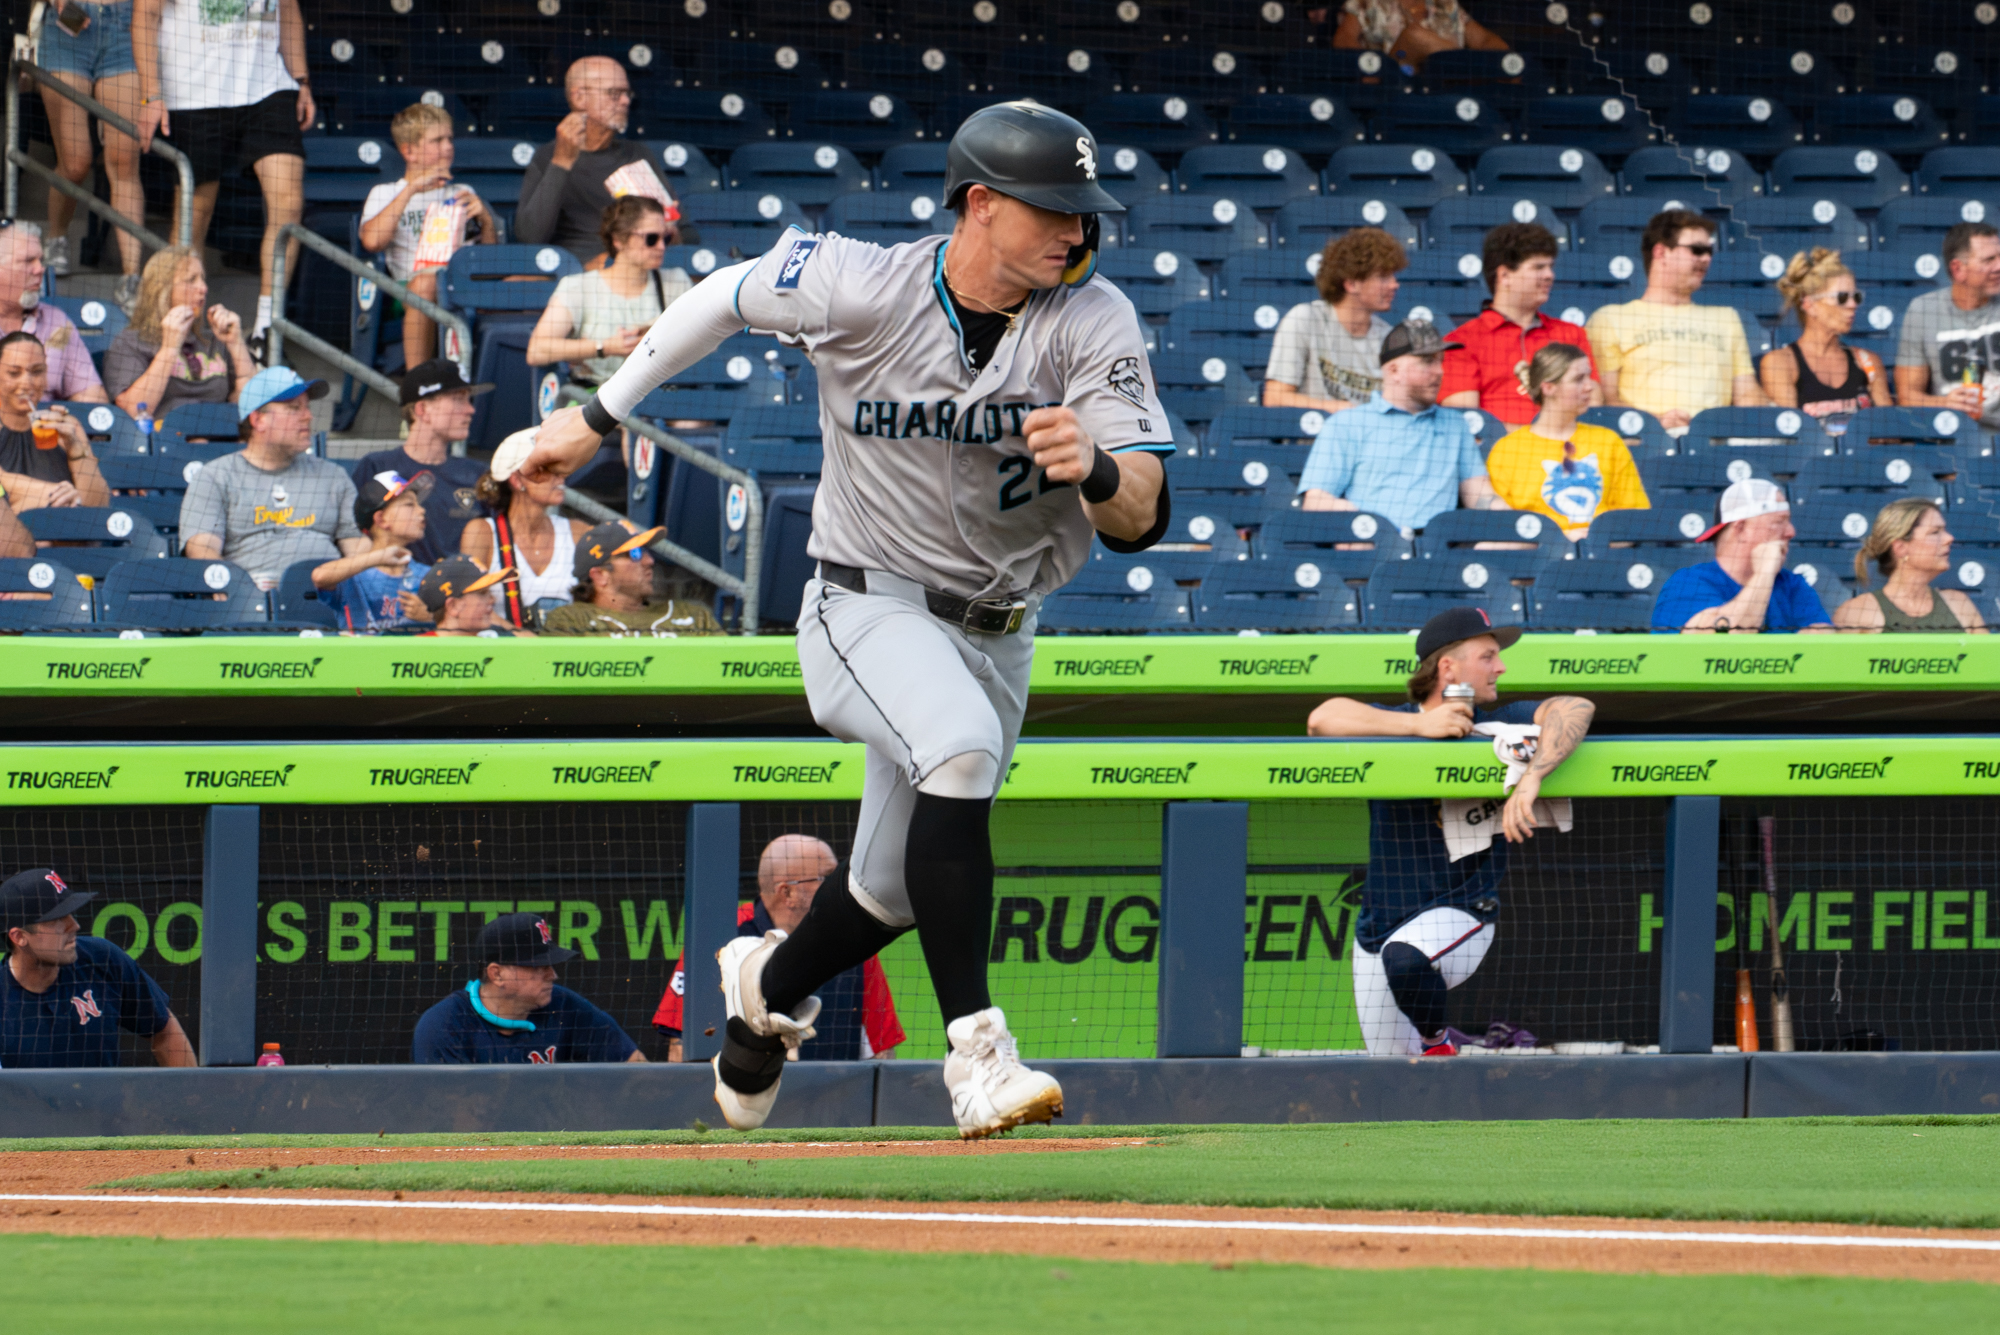
(Photo by William Purnell/Icon Sportswire)